Sure, let's perform a technical analysis on the chart provided:
1. **Trend Analysis:**
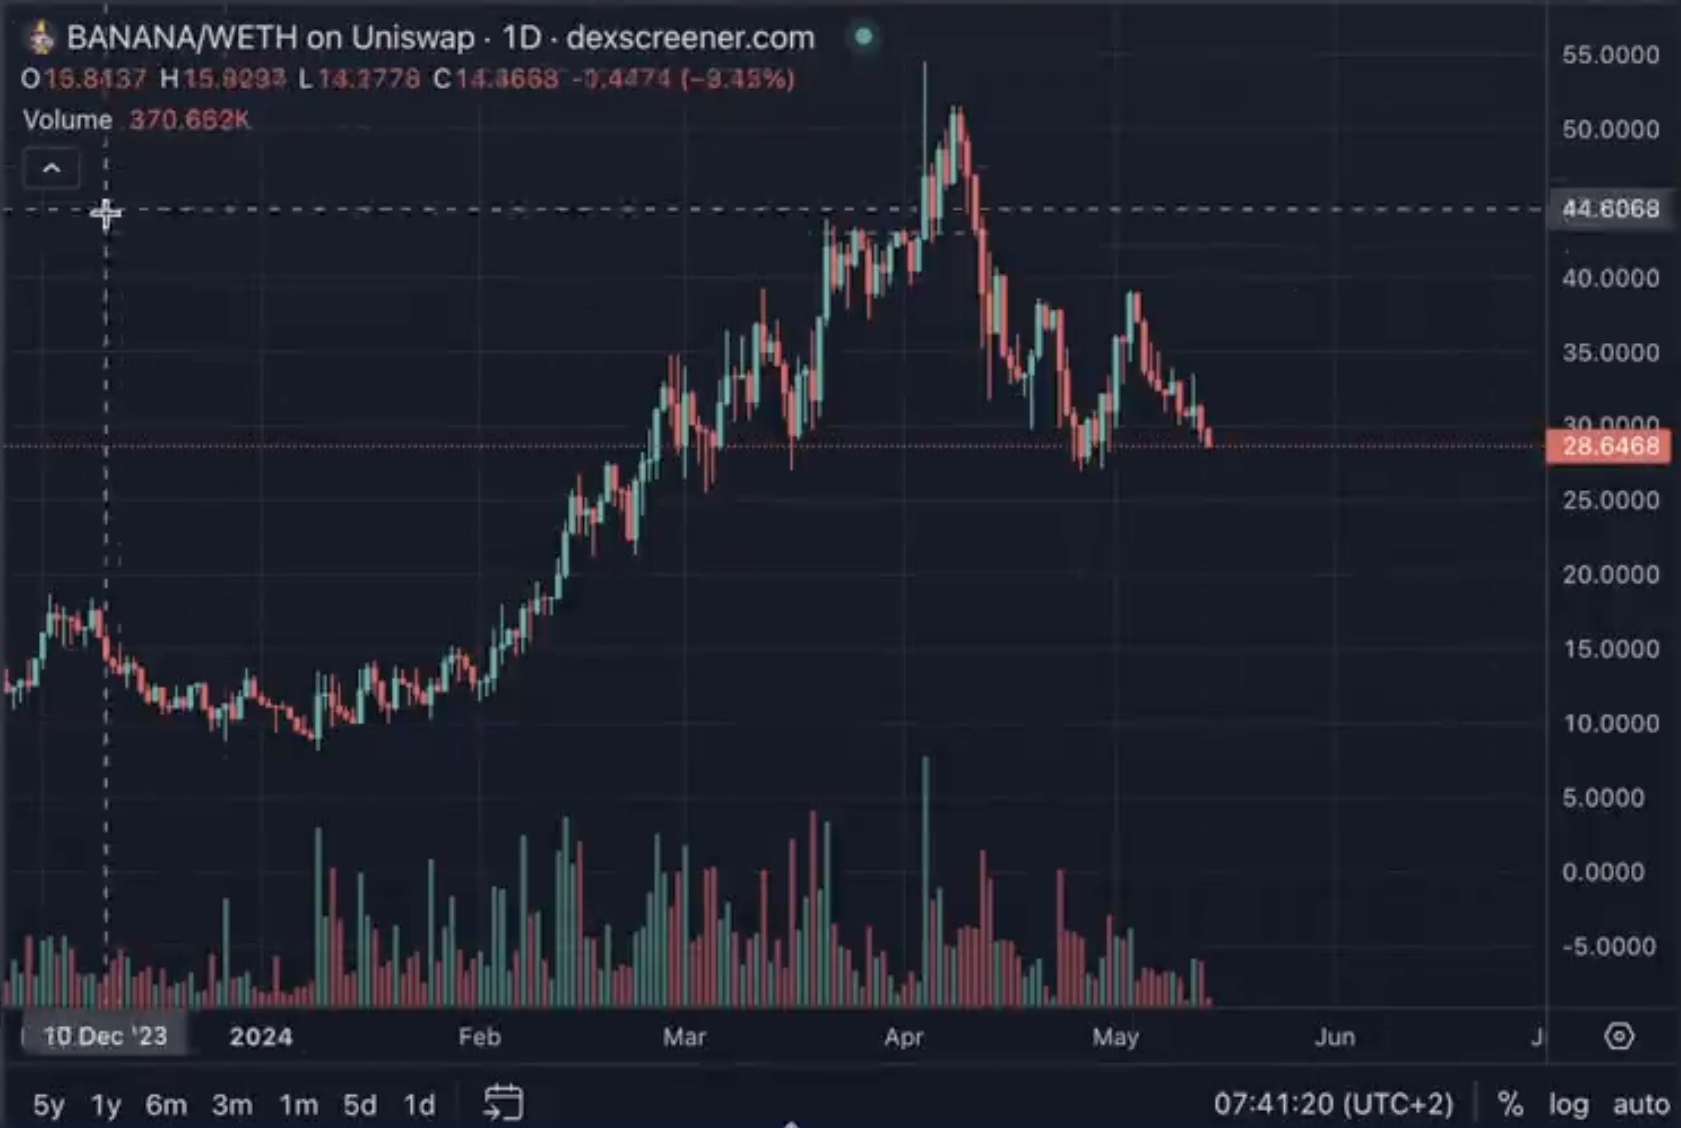
- The chart shows a strong uptrend from December to the peak around late April. This indicates buyers were in control during this period.
- Following the peak, there is a clear downtrend indicating a reversal, with lower highs and lower lows forming.
2. **Support and Resistance:**
- **Resistance:** Around 44.6, where the price previously reversed. This could act as a barrier if the price approaches this level again.
- **Support:** Currently around the 28.6 level, as the price is testing this as a potential support level. If it breaks, the next support could be lower.
3. **Volume Analysis:**
- Volume spikes align with certain price movements. For instance, higher volume in April correlates with the peak, suggesting strong activity and potential reversal.
- Decrease in volume during the recent downtrend might indicate weakening selling pressure.
4. **Candlestick Patterns:**
- Observe for any reversal patterns like hammers or engulfing candles at key support/resistance levels for potential trend reversals.
5. **Moving Averages:**
- Adding moving averages (e.g., 50-day and 200-day) can help identify ongoing trends and potential crossovers for buy/sell signals.
Overall, the recent price action suggests a bearish sentiment, but be watchful of the current support level and reversal indicators. Always use risk management when trading.